THE LINUX FOUNDATION PROJECTS
Icon

Open source · community-built

An open foundation for modern grid planning

OpenGrid brings transparent tools, shared data, and open governance to the people modeling, planning, and modernizing grids worldwide, so new infrastructure moves from plan to power faster.

Join our SubstackStart contributing

Building the grid of the future takes planning that moves faster, reaches more people, and keeps pace with a grid growing in size and complexity.

Energy projects take decades from plan to power and speed is critical

5-15 years typical plan-to-power timeline
57% increase in the volume of new electricity added globally each year

Key drivers

Tools

  • Siloed and black-box planning: Generation, transmission and distribution work with varied assumptions, reducing confidence in decisions.
  • Restudy cycles: Changed assumptions or updated data
  • Data: Scarcity of easily accessible, comprehensive, verified and validated open data sets

Human

    • Distrust: Models are cumbersome, not easily replicable and require specialized skillsets

Grid modeling is only done by a narrow set of modelers today

5-10% of modelers have commercial tool access

Key drivers

  • Low accessibility: modeling tools, onboarding, and talent are out of reach
  • Reactive mode: limited capacity forces teams to prioritize reliability and outages
  • Opaque outputs: Model results rarely reach decision-makers in a form they can use.

Today’s planning tools were built for yesterday’s grid

7x VRE Growth Variable renewable energy’s share of global electricity generation rose from 4% in 2015 to 15% in 2024 and is projected by the IEA to almost double again, reaching 28% by 2030.

Key drivers

  • Tools unfit for planning grids for high intermittency and flexibility: increasingly weather dependent systems and proliferation of distributed energy resources including storage and flexibility require a step change in modeling sophistication.
  • Lack of new technology representation: New technology opportunities such as long duration energy storage and advanced conductors remain untapped if we don’t have the data and methods to easily model them.

OpenGrid is building an open-source platform, convening the ecosystem around it, and establishing trusted, neutral governance.

Platform

Builds an open-source tooling platform with accessible data and modeling that make grid planning more interoperable and higher-fidelity.

Ecosystem

Convenes builders, users, funders, and institutions around a shared vision and coordinated agenda.

Governance

Provides neutral capital through a proven legal and governance structure at the Linux Foundation.

One open platform, powerful interoperable components

OpenGrid’s foundation is robust, trusted, open data, with task-ready applications layered on top.

Who is it for?

OpenGrid serves everyone working to modernize the grid.

Grid planners & large loads

Model and plan the grid with open tooling.

Start exploring

Developers & contributors

Build on OpenGrid and help shape the ecosystem.

Start contributing

Regulators, researchers, & other stakeholders

Access transparent, reproducible grid models and data.

Discover the platform

Partners & funders

Back an open foundation for the energy transition.

User Journeys

Two journeys show how OpenGrid’s components that are being built to work together for the people planning the grid today. OpenGrid’s first tools are expected in 2027; these journeys show where they lead.

Who: A regulatory analyst at a regulatory commission, a climate-focused civil society group, a consumer advocate or another utility.

The situation: A utility presents the results of its Integrated Resource Plan, produced in commercial capacity expansion and production cost models. The analyst can obtain the utility’s input file but can’t afford a license for the same tool. Yet they must evaluate a multi-billion-dollar proposal whose impact will last a decade or more.

OpenGrid vision: The analyst moves through four stages:

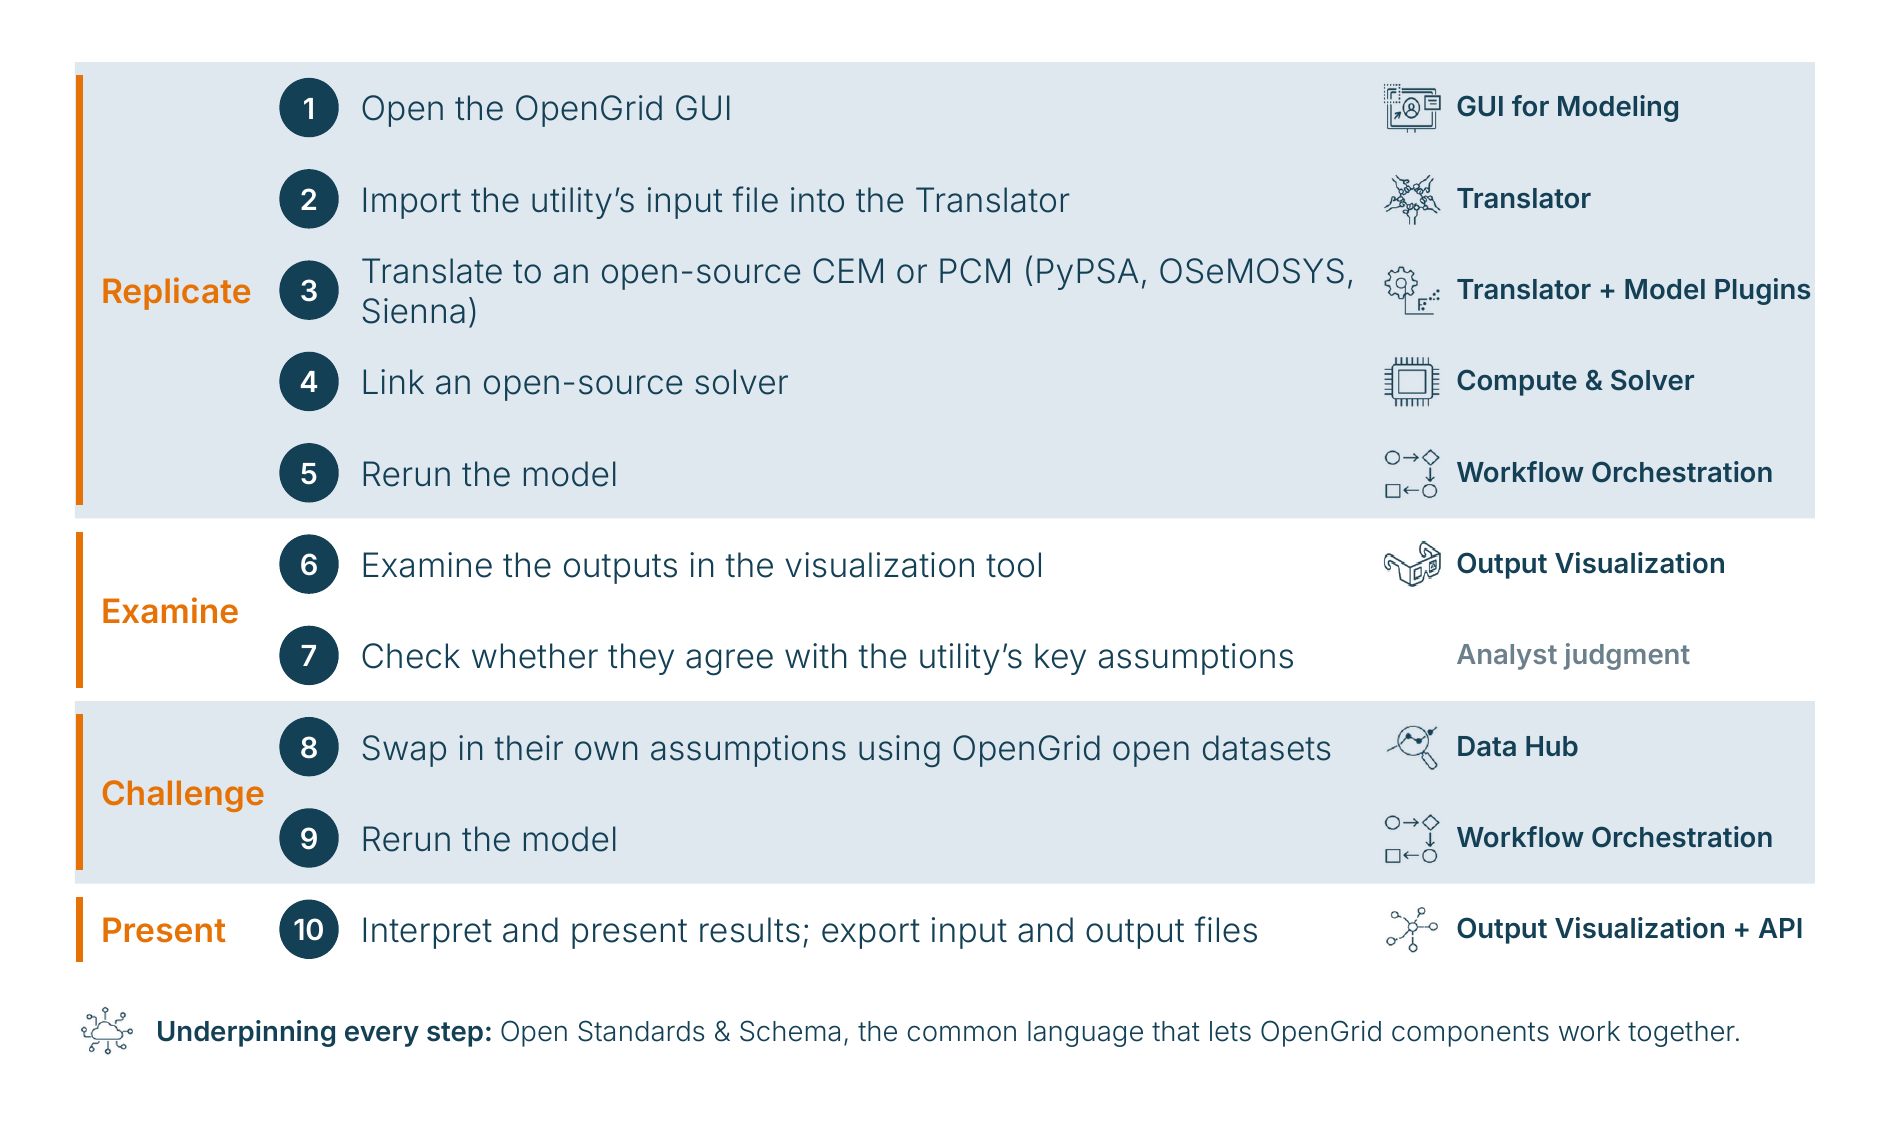
  1. Replicate: Open the Modeling GUI, import the utility’s input file into the Translator, and translate it to an open-source capacity expansion or production cost model such as PyPSA, OSeMOSYS or Sienna. Link an open-source solver and rerun the model.
  2. Examine: Review the outputs in Output Visualization and check whether they agree with the utility’s key assumptions.
  3. Challenge: Swap in their own assumptions using open datasets from the Data Hub, then rerun the model.
  4. Present: Interpret and present the results and export the input and output files so others can reproduce the analysis.

Impact on speed: The review starts from the utility’s own input file, not a blank page. Instead of rebuilding the model by hand, the analyst translates it and reruns it in open tools. Analyst presents a logical, tested model. More alignment and efficiency in review processes.

Impact on reach: A multi-billion-dollar plan becomes accessible for other stakeholders to review without a license fee. One enterprise license for a commercial market-simulation tool can cost about a year of a US modeler’s salary, ten years in India and twenty-five years in Nigeria.


Who: A distribution system planner at a utility with an extremely tight budget, if not a deficit.

The situation: An influx of distributed solar is creating adverse conditions on the system that the planner can neither predict nor analyze with current tools. The commercial tools that could help are out of reach. To move forward, the planner needs to show leadership what the issues are and seek approval.

OpenGrid vision: The planner moves through four stages:

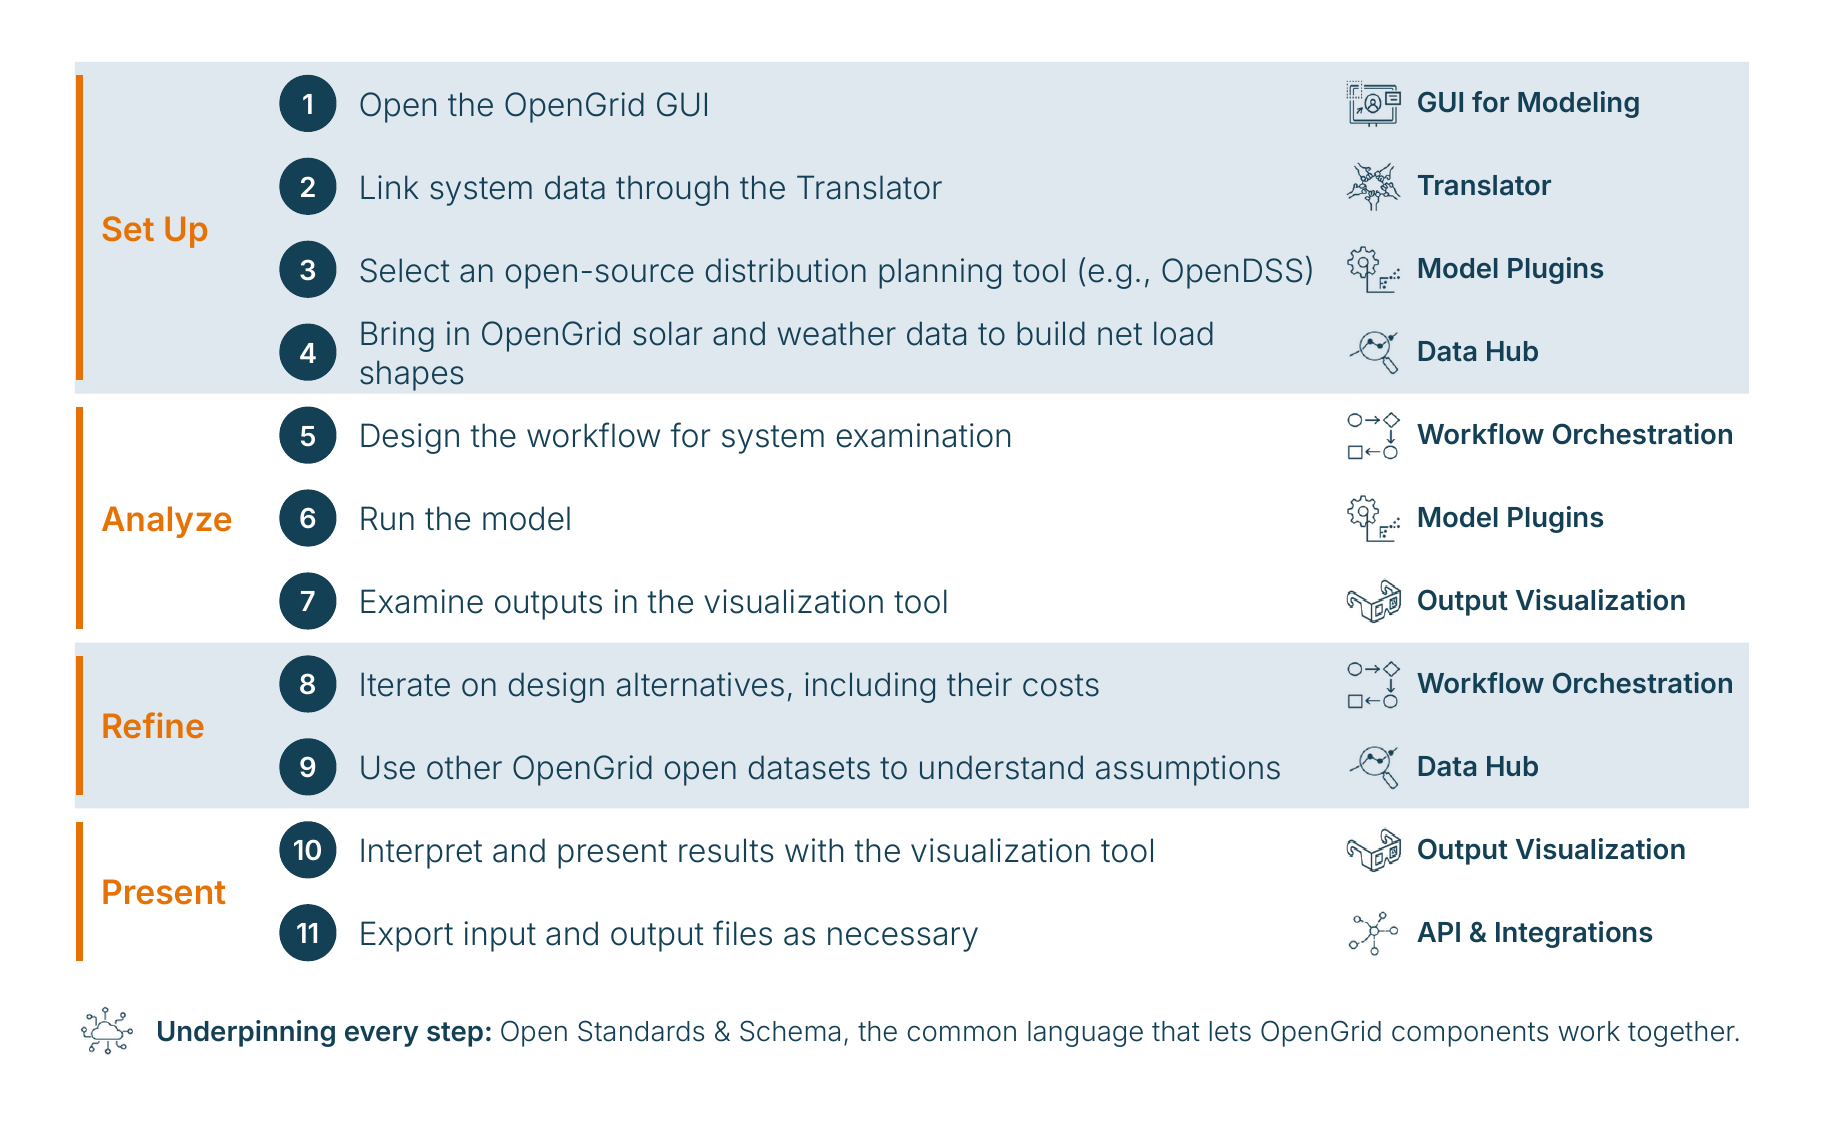
  1. Set up. Open the Modeling GUI, link the utility’s system data through the Translator, and select an open-source distribution planning tool such as OpenDSS. Bring in solar and weather data from the Data Hub to build net load shapes.
  2. Analyze: Design the workflow for examining the system, run the model, and review the outputs in Output Visualization.
  3. Refine: Iterate on design alternatives, including their costs, and use other open datasets to understand the assumptions.
  4. Present: Interpret and present the results to leadership and export the input and output files as needed.

Impact on speed: Solar and weather data arrive ready to use, so the planner’s time goes into designing solutions, not assembling inputs.

Impact on cost: A utility that couldn’t afford commercial tools still puts a costed, defensible plan in front of leadership, with no license to buy.

Backed by a growing network of partners

The organizations funding, building, and shaping OpenGrid.

Built in the open, with the community

OpenGrid is a community effort. Join the conversation, contribute code, or help shape where the project goes next.

Explore the communityJoin Zulip